How to Calculate Facebook Engagement Rate
Facebook’s own reach-vs-impressions quirk trips up more calculations than the formula itself does — here’s how to get it right.
Facebook organic reach has been declining for years, which makes engagement rate more important than ever as a way to judge whether a Page’s content still resonates, independent of how few people the algorithm is currently showing it to. Learning how to calculate Facebook engagement rate starts with understanding a distinction Facebook draws that most other platforms don’t bother with: reach and impressions are genuinely different numbers, and picking the wrong one changes your result meaningfully.
Calculate Your Facebook Engagement Rate →
Why Learning How to Calculate Facebook Engagement Rate Matters Now
Organic reach on Facebook has declined steadily for years as the platform prioritizes paid distribution and content from friends and family over Pages in the feed. This makes raw metrics like follower count increasingly disconnected from actual performance — a Page can grow its audience while its typical post reaches a shrinking fraction of that audience, making engagement rate one of the few numbers that still reflects genuine content quality rather than algorithm favor.
It also gives Page managers a way to justify budget and strategy decisions with real data instead of gut feeling. A declining engagement rate over several months is a much clearer signal to shift content strategy than a vague sense that “posts aren’t doing as well,” and it’s measurable in a way stakeholders can actually track quarter over quarter.
How to Calculate Facebook Engagement Rate: Reach vs Impressions
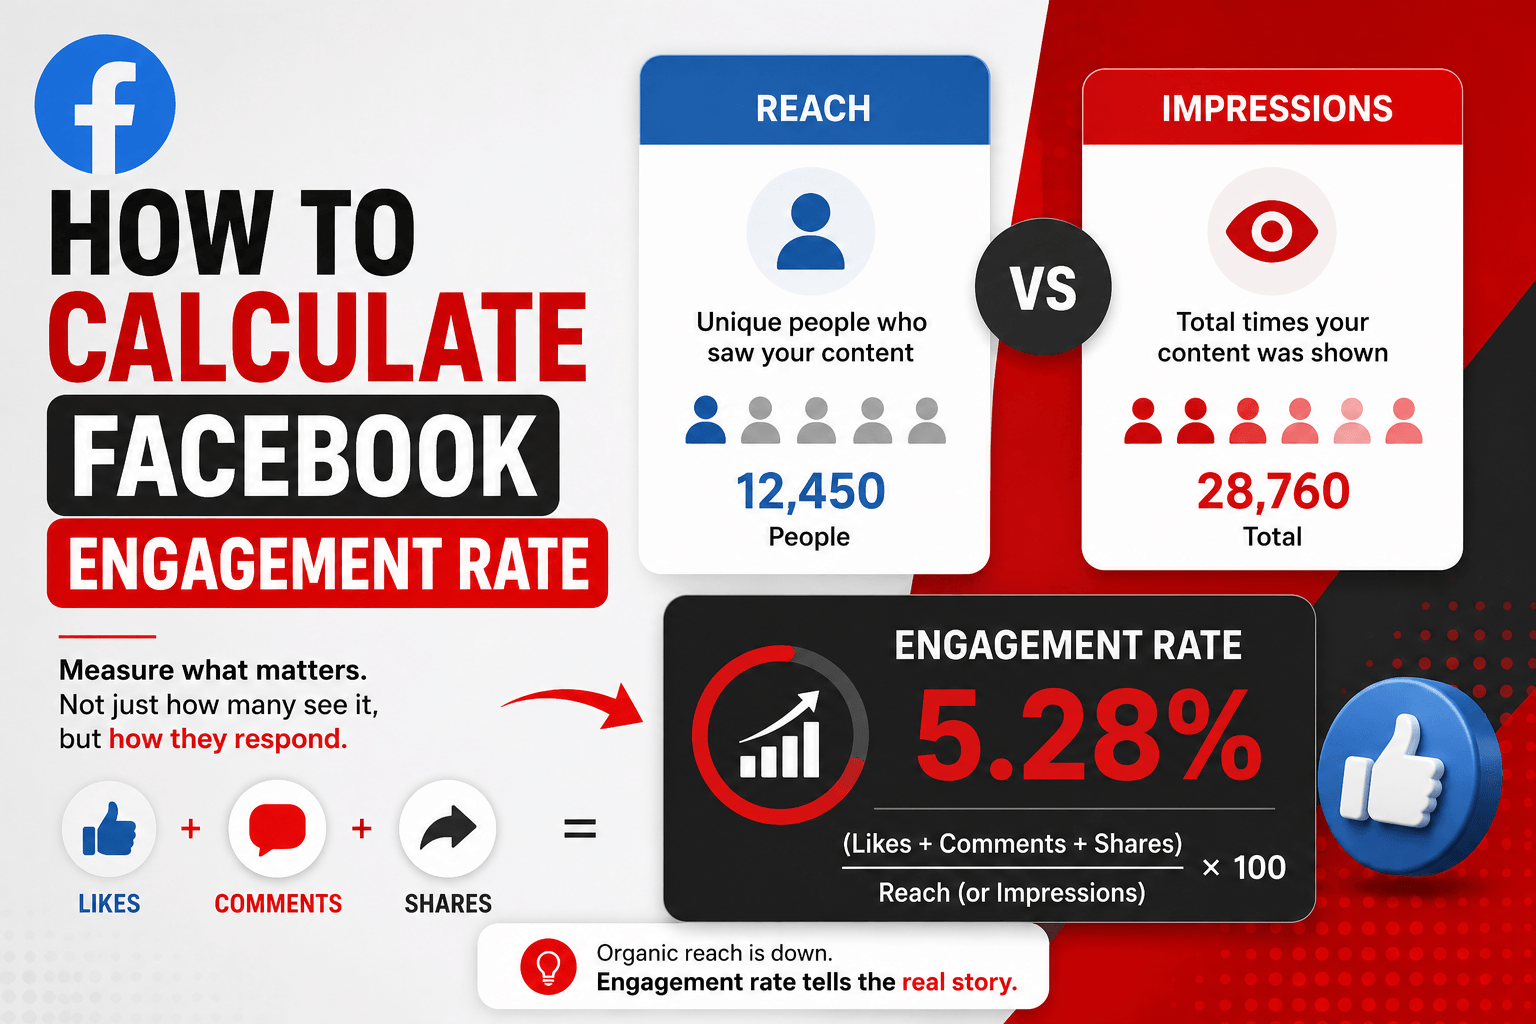
Most engagement rate formulas divide by one denominator without much debate. Facebook is the exception, since it separately tracks how many unique people saw a post versus how many total times it was displayed. According to a current breakdown of reach versus impressions across social platforms, this distinction between unique viewers and total displays holds consistently across Meta’s own reporting, even as some platforms have shifted the exact terminology they use for each.
Reach
The number of unique people who saw the post at least once. One person seeing it three times still counts as one.
Impressions
The total number of times the post was displayed, including repeat views by the same person scrolling back past it.
Since impressions are always equal to or higher than reach, dividing engagement by impressions instead of reach produces a lower, more conservative engagement rate. Most standard Facebook engagement rate calculations use reach as the denominator, since it better represents the actual audience size a post connected with.
How to Calculate Facebook Engagement Rate: The Formula
The most common version of Facebook engagement rate looks like this:
Engagement Rate = (Reactions + Comments + Shares + Clicks) ÷ Reach × 100
Facebook groups reactions (Like, Love, Care, Haha, Wow, Sad, Angry) together as a single engagement category, alongside comments, shares, and post clicks. Video views are sometimes included separately depending on the specific report being pulled, so it’s worth confirming which metrics a given analytics view is actually counting before comparing numbers across posts.
This is essentially the same core logic every major platform uses for engagement rate — total meaningful interactions divided by the size of the audience that saw the content — but the specific metric Facebook offers as the denominator (reach) is what sets its version apart from platforms that default to impressions or follower count instead.
Calculate Your Facebook Engagement Rate →
Example: How to Calculate Facebook Engagement Rate Step by Step
A Page publishes a post that reaches 8,500 unique people and receives 210 reactions, 34 comments, and 19 shares.
Total engagement: 210 + 34 + 19 = 263. Divide by reach: 263 ÷ 8,500 = 0.0309. Multiply by 100: 3.09% engagement rate — a strong result relative to typical Facebook Page benchmarks.
Now compare a second post from the same Page that reaches 22,000 people but earns only 180 total engagements. That works out to 180 ÷ 22,000 × 100 = 0.82% — a noticeably weaker rate despite reaching more than double the audience. Reach alone would suggest the second post performed better; the engagement rate tells a more complete story about how each post actually connected with the people it reached.
Benchmarks by Page Size
One consistent pattern on Facebook: engagement rate tends to fall as Page size grows, since larger audiences are naturally less uniformly interested in every single post. A follower who joined a Page years ago for one specific reason may simply be less invested in most of what gets posted today, diluting the average without any single post actually being weak.
This means comparing a small local business Page’s engagement rate directly against a major brand’s is rarely a fair comparison — Page size needs to be part of the context, not just the raw percentage. A 0.4% rate on a Page with half a million followers can represent far more total engaged people, in absolute terms, than a 3% rate on a Page with two thousand.
The Same Formula, a Different Platform
If you’re tracking engagement across multiple networks, the underlying formula stays conceptually similar — see How to Calculate LinkedIn Engagement Rate for how the same core idea applies with LinkedIn’s specific metrics and benchmarks.
Mistakes People Make Trying to Calculate Facebook Engagement Rate
Frequently Asked Questions
How to calculate Facebook engagement rate: should I use reach or impressions?
What’s a good Facebook engagement rate?
Do video views count as engagement on Facebook?
Does paid reach affect the engagement rate calculation?
Why does my Page’s engagement rate keep declining even though follower count is growing?
How often should I recalculate my Page’s engagement rate?
Can I compare my Facebook engagement rate to my Instagram engagement rate directly?
Final Thoughts
Now that you know how to calculate Facebook engagement rate correctly, start by picking reach over impressions as the denominator, then track the result consistently across posts rather than judging any single one in isolation. Compare against benchmarks that account for your Page’s actual size, and treat a declining percentage during real follower growth as normal rather than alarming — it’s usually the audience broadening, not the content getting weaker.