What Is a Facebook Engagement Rate Calculator?
A Facebook Engagement Rate Calculator is a free online tool that instantly tells you how well your Facebook posts or page content is performing — expressed as a clean, comparable percentage. Rather than pulling out a spreadsheet every time you want to evaluate a post, you simply enter your reactions, comments, shares, and your chosen denominator (impressions, reach, or followers), and the calculator does the math in seconds.
Whether you are a brand manager tracking monthly page performance, a social media agency reporting to clients, or a small business owner trying to figure out which posts actually connect with your audience, this Facebook engagement rate calculator gives you a precise, data-backed answer — instantly and for free. It is one of the many free tools available at onlinetoolix.
Why Engagement Rate Matters More Than Likes or Followers
Follower count is vanity. Engagement rate is reality.
A Facebook page with 200,000 followers and 0.2% engagement is generating fewer meaningful interactions than a page with 8,000 followers and 4% engagement. Facebook's own algorithm knows this — it deprioritizes content from pages with low engagement relative to their audience size, which means low engagement creates a self-reinforcing downward spiral of declining organic reach.
When you regularly calculate engagement rate on Facebook, you are measuring the actual health of your content strategy, not just the size of your audience. It is the single most important metric for understanding whether your content is resonating, whether your audience targeting is working, and whether your overall Facebook presence is growing in the right direction.
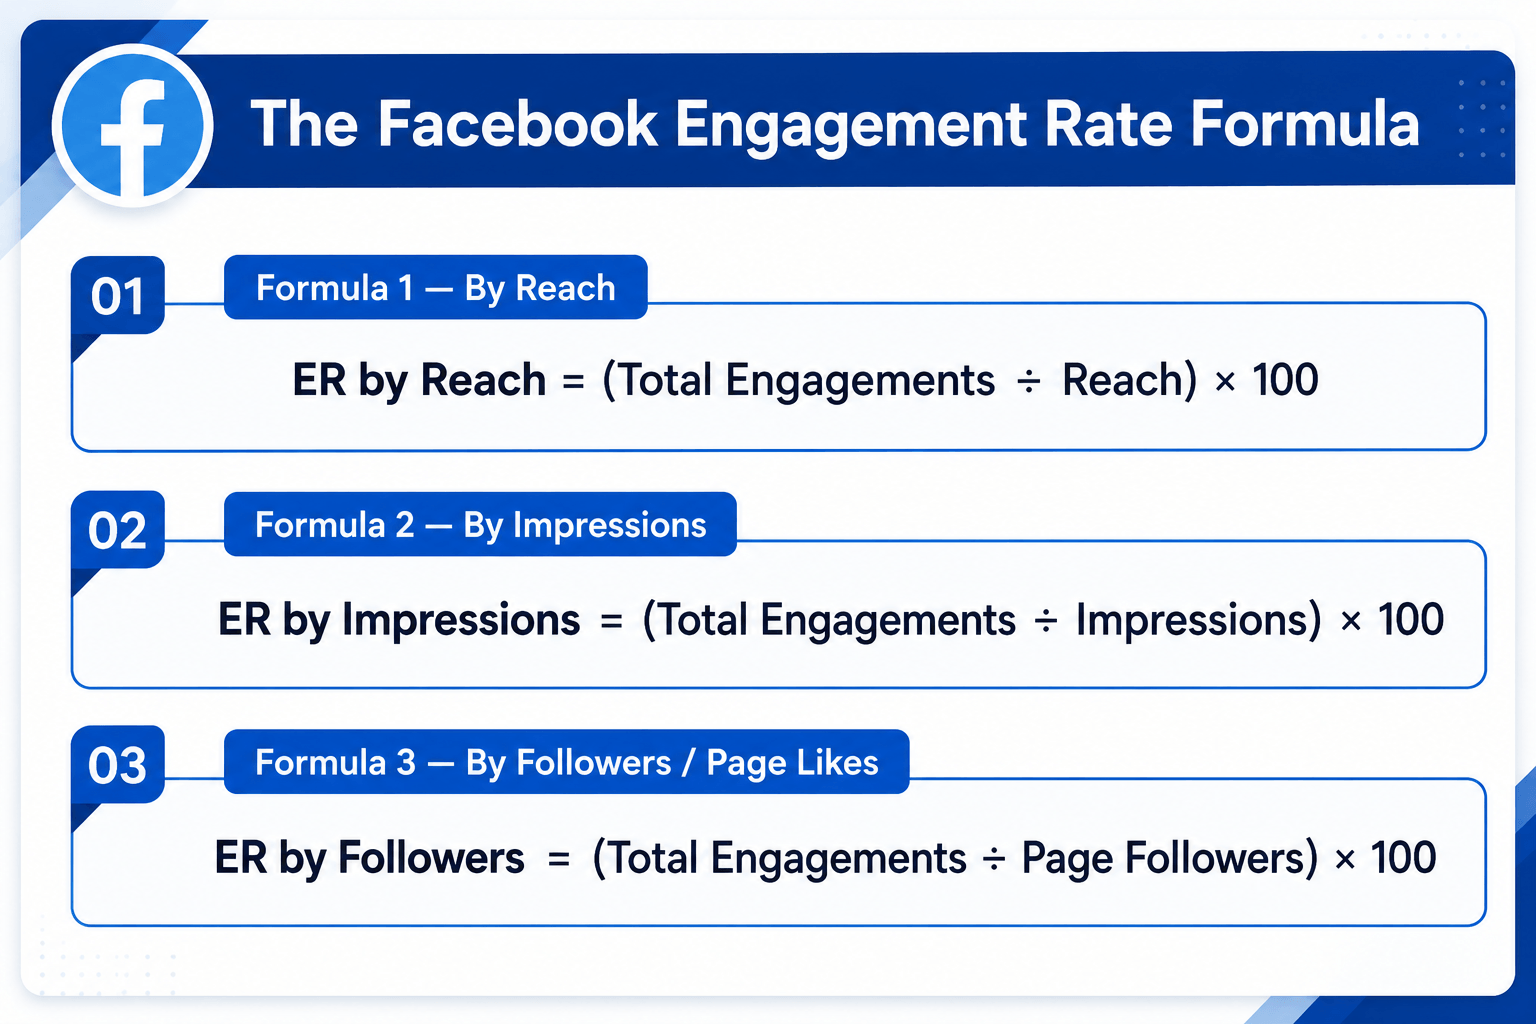
The Facebook Engagement Rate Formula
Knowing how to calculate engagement rate on Facebook starts with understanding that there is no single "official" formula — there are three, and they produce very different numbers. Choosing the right one depends on what data you have access to and what you are trying to measure.
This is the formula Facebook itself uses in its native Insights dashboard, and it is the most accurate measure of content quality. Reach refers to the number of unique people who actually saw your post — not how many times it was displayed.
Impressions count every single time a post was displayed, including multiple views by the same person. This formula is useful for paid campaign reporting, where impressions data is always readily available.
This is the most commonly cited formula in third-party benchmark reports. Since you can see a competitor's follower count but not their reach or impressions, this formula is the only practical option for competitor analysis.
Use Reach When...
You have Insights access and want the most accurate post-level measurement. This is the recommended formula for day-to-day content performance tracking.
Use Followers When...
Competitor benchmarking or presenting standardised monthly reports. It's the only option when you don't manage the page directly.
Use Impressions When...
Reporting on paid campaigns, where frequency and total exposures are the key metrics being tracked and optimised.
Our Calculator Supports All Three
Simply toggle between reach, impressions, and followers before calculating — no need to switch tools or recalculate manually.
What Counts as an Engagement on Facebook?
To accurately calculate engagement rate on Facebook, you need to know exactly which interactions count. Facebook includes the following in its engagement metrics:
| Engagement Type | What It Includes |
|---|---|
| Reactions | Like, Love, Haha, Wow, Sad, Angry — all six count equally |
| Comments | All top-level comments and replies on a post |
| Shares | Shares to timelines, groups, and direct messages |
| Clicks | Link clicks, photo expansions, video plays, "See More" clicks |
Facebook's algorithm gives slightly more weight to non-Like reactions (especially Love and Wow) as signals of stronger emotional engagement, and it prioritises comments and shares over reactions — but for the standard engagement rate calculation, all interactions are counted equally in the numerator.
Note on clicks: Facebook includes clicks as engagement in its internal metrics, but many third-party tools omit clicks from their calculation. Our calculator gives you a dedicated clicks field so your result matches what you see in Facebook Insights exactly.
How to Calculate Engagement Rate on Facebook — Step by Step
The tool has three modes: Calculate Engagement Rate (enter your metrics, get your ER instantly), Find Required Impressions/Reach/Followers (work backwards from a target ER), or Find Required Engagements (set a target ER and impressions to find how many engagements you need).
Toggle between Impressions, Reach, or Followers depending on which data you have available from Facebook Insights or Meta Business Suite.
Fill in your reactions, comments, shares, and clicks individually — or enter a single total engagements figure if you have already summed them up.
Input your impressions, reach, or follower count from Facebook Insights or Meta Business Suite.
Your engagement rate appears instantly as a percentage, alongside a performance grade benchmarked against 2026 industry standards and a full breakdown of the inputs. No login. No subscription. Completely free — use it as often as you need.
How to Find Your Facebook Metrics for This Calculator
Go to your Facebook Page → find the post → click "View Insights" below it. You will see reactions, comments, shares, clicks, reach, and impressions broken down for that specific post.
Open Meta Business Suite → go to Insights → Content → select a date range. You can view per-post metrics including reach, impressions, and total engagement in a sortable table. Click Export Data to download a CSV for bulk analysis.
Go to Meta Business Suite → Insights → Overview. The page-level engagement rate shown here is calculated by Facebook as total engagements divided by reach across all posts in the selected period.
You can only use the followers-based formula for competitor research since you do not have access to their Insights. Check their public follower count, count engagements on individual posts manually or via a tool, and use Formula 3 above.
Facebook Engagement Rate Benchmarks 2026
Once you calculate Facebook engagement rate for your page, the next step is putting that number in context. According to Socialinsider's 2026 Facebook Benchmarks Report, here is what the data shows:
Overall Platform Benchmarks
| Formula Used | Average Facebook ER (2026) |
|---|---|
| By Followers | 0.15% – 0.60% |
| By Reach | 1.0% – 3.6% |
| By Impressions | 0.5% – 2.0% |
Important: The wide variation in published benchmarks is almost always a formula discrepancy — one source divides by followers, another by reach. Always compare your rate against benchmarks that used the same denominator.
What Your Rate Means (By Reach — Recommended Formula)
| ER by Reach | Performance Level |
|---|---|
| Below 1% | Below average — content or targeting needs work |
| 1% – 3% | Average — solid baseline, room to improve |
| 3% – 6% | Good — above platform average, strong strategy |
| Above 6% | Excellent — top performing content |
By Industry (Follower-Based, 2025–2026)
| Industry | Average Facebook ER |
|---|---|
| Food & Beverage | 1.5% – 2.5% |
| Health & Fitness | 1.5% – 2.5% |
| Nonprofits / NGOs | 1.5% – 2.0% |
| Education | 1.2% – 2.0% |
| Travel & Hospitality | 1.0% – 2.0% |
| Retail & E-commerce | 1.0% – 1.5% |
| Media & Entertainment | 1.0% – 2.5% |
| Technology & Software | 0.5% – 1.8% |
| Financial Services | 0.5% – 1.2% |
By Content Format
| Format | Typical ER by Reach |
|---|---|
| Reels / Native Video | 2x – 3x standard posts |
| Carousels / Multi-image | 1.5x – 2x standard posts |
| Single Image | Baseline |
| Link Posts | Below baseline |
| Text-only Posts | Below baseline |
By Page Size
| Page Followers | Typical ER by Followers |
|---|---|
| Under 1,000 | 3% – 8% |
| 1,000 – 10,000 | 1% – 3% |
| 10,000 – 100,000 | 0.3% – 1.5% |
| 100,000+ | 0.1% – 0.5% |
Smaller pages consistently outperform larger pages on a percentage basis. This is normal and expected — do not benchmark a 2,000-follower local business against a 500,000-follower national brand.
Facebook Reach vs. Impressions vs. Followers — Which Denominator Is Right for You?
One of the most common sources of confusion when you calculate engagement rate on Facebook is which denominator to use. Here is a plain-English guide:
Reach is the most accurate denominator for measuring content quality. It tells you what percentage of people who actually saw your post chose to interact with it. Facebook uses reach in its own native engagement rate calculations in Insights. Use this when you have Insights access and want the truest picture of post-level performance.
Impressions count every display of a post — so one person seeing the same post three times counts as three impressions. This inflates the denominator and deflates your engagement rate. Most useful for paid campaign reporting where frequency and total exposures are the key metrics.
Followers is the most comparable denominator for external benchmarking. Because it is publicly visible, it is the only option for competitor analysis and the basis of most published industry benchmark reports. However, since only 2%–5% of your followers see any given organic post in 2026, dividing by total followers gives a very conservative engagement rate.
If your in-house team and your agency report different engagement rates for the same campaign, it is almost certainly because they are using different denominators. Standardise on one formula — ideally reach — and stick to it consistently.
Why This Facebook Engagement Rate Calculator Stands Out
Impressions, reach, and followers all in one place. Most free calculators only support one.
Calculate your current ER, find required reach to hit a target, or find required engagements to hit a target rate. Ideal for planning campaigns before they go live.
Reactions, comments, shares, and clicks each have their own field, matching exactly what Facebook Insights reports. Most tools lump everything into a single "engagements" field.
No account creation, no email capture, no subscription. Use it unlimited times at no cost.
Enter your numbers and your engagement rate appears immediately alongside a contextual performance grade benchmarked against 2026 standards.
8 Proven Ways to Improve Your Facebook Engagement Rate
If your results from the Facebook engagement rate calculator are lower than you would like, here are the highest-impact improvements supported by 2026 data:
Facebook is aggressively prioritising Reels in the algorithm in 2026. Short-form native video is the single biggest format opportunity on Facebook right now — more reach compounds into more absolute interactions over time.
Carousels generate significantly higher engagement than single-image posts because they encourage swiping — an interaction that Facebook counts as a click. They also keep users on the post longer, which the algorithm treats as a positive signal.
Use Facebook Insights → Audience → When Your Fans Are Online to identify your page's peak activity windows. Generic advice says Tuesday to Thursday, 9am–1pm — but your audience's behaviour may differ. Post when they are most active.
"What do you think?" generates almost no engagement. "Which of these two options would you actually use, and why?" generates comments. Specificity drives responses. End every post with a direct, easy-to-answer question your audience genuinely has an opinion about.
Facebook Live videos generate, on average, 6x more interactions than regular videos. The algorithm pushes live notifications to a higher percentage of your followers than any other content type. Even a 10-minute unpolished live Q&A will typically outperform a professionally produced static image post.
Facebook's algorithm interprets your replies as additional engagement signals on the post. Responding quickly in the first 60–90 minutes after posting extends your post's window of algorithmic promotion and often triggers a second wave of organic reach.
Posts that include external links are penalised by Facebook's algorithm because they take users off the platform. If you need to share a link, put it in the first comment rather than the post body, and describe the content natively in the post itself.
Groups consistently generate higher engagement rates than Pages because group members are self-selected based on shared interest. Cross-posting relevant content to active groups — where you are a genuine contributor, not just a broadcaster — can dramatically amplify reach and engagement for zero additional budget.
Facebook vs. Other Platforms — Engagement Rate Context
When you calculate Facebook engagement rate and compare it to your other channels, keep these platform-level benchmarks in mind (2026, by followers):
| Platform | Average ER by Followers (2026) |
|---|---|
| TikTok | 2.0% – 4.86% |
| 2.1% – 3.85% | |
| 0.45% – 0.6% | |
| 0.15% – 0.6% | |
| X (Twitter) | 0.03% – 0.12% |
Facebook sits in the lower range of major platforms by follower-based engagement rate — but this is almost entirely explained by the fact that only 2%–5% of followers organically see any given post. On a reach-based calculation, Facebook's numbers are significantly more competitive. The platform still has the largest global user base of any social network and delivers strong results for video content, community building, and paid amplification. For tracking LinkedIn performance separately, use our LinkedIn Engagement Rate Calculator.
Frequently Asked Questions
Engagement rate is the single clearest signal of whether your Facebook content strategy is working. This free calculator gives you that number instantly — across three formulas and three calculation modes — with no sign-up required.
Run your numbers, compare them against the 2026 benchmarks above, and use the eight improvement strategies to move the needle. Combine this tool with our LinkedIn Engagement Rate Calculator, Cost Per Click Calculator, and SEO ROI Calculator for a complete view of your digital marketing performance — all free on Onlinetoolix.