How to Calculate Break Even ROAS (Formula + Real Examples)
The one number that tells you whether an ad campaign is actually profitable, not just “working.” Formula, worked examples, and the mistakes that quietly wreck the calculation.
A campaign can hit a “good” ROAS on paper and still lose money the moment you account for product cost, shipping, and payment fees. That gap is exactly why knowing how to calculate break even ROAS matters more than watching the headline return number in your ads dashboard. Break even ROAS tells you the exact point where a campaign stops costing you money and starts making it. Everything below that number is a loss, no matter how good it looks in a screenshot.
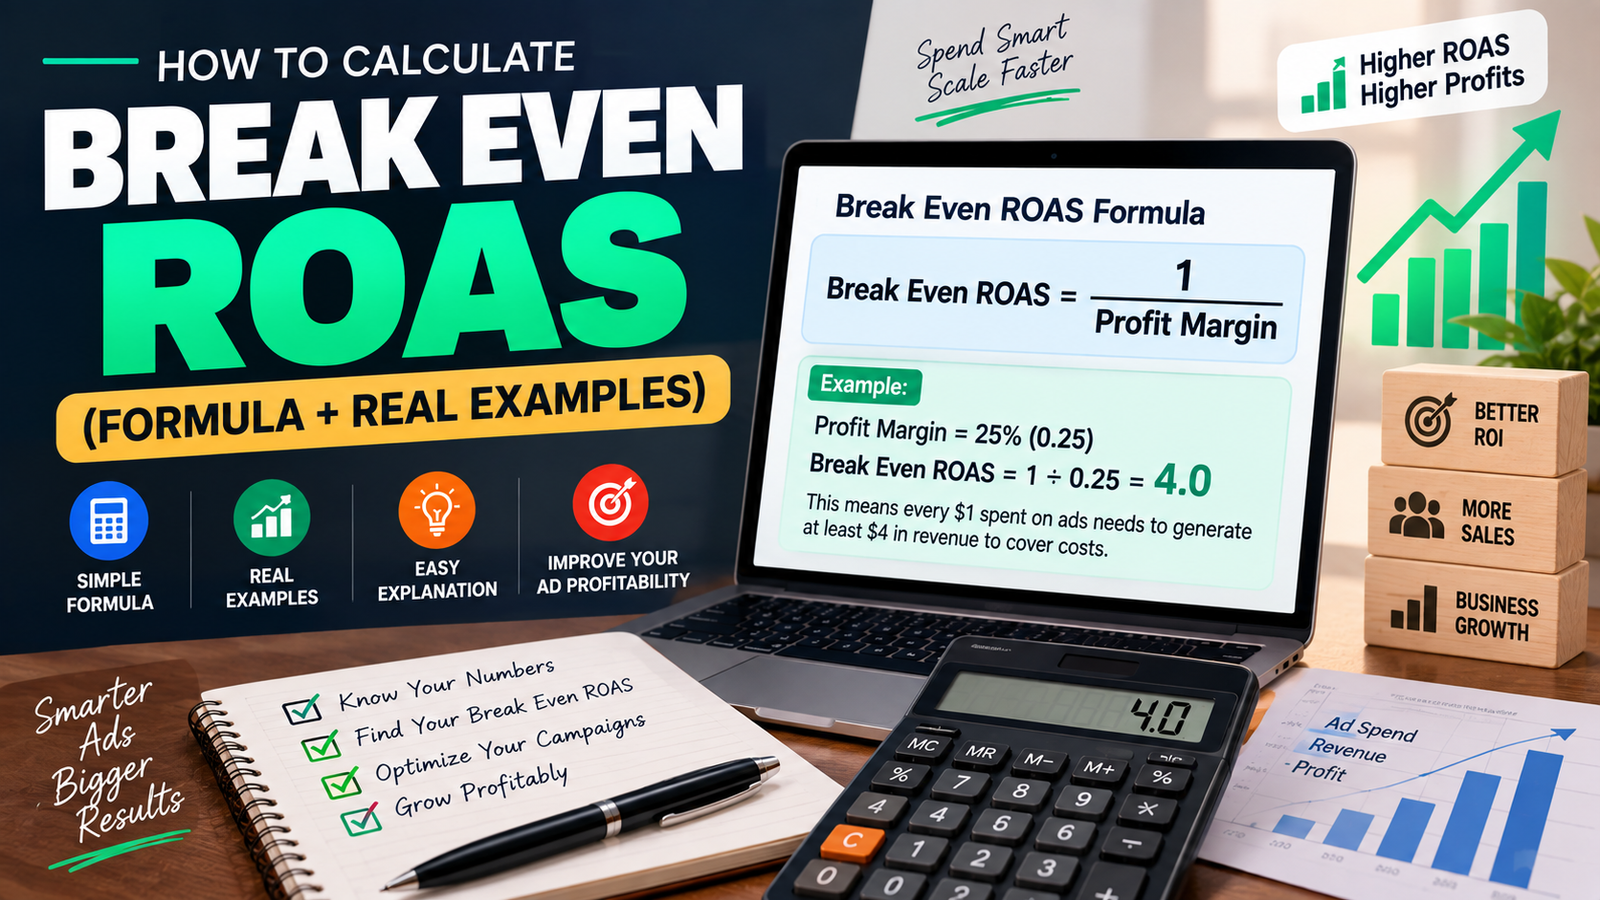
To calculate break even ROAS, divide 1 by your profit margin (expressed as a decimal): Break Even ROAS = 1 ÷ Profit Margin. A 25% margin gives a break even ROAS of 4.0, meaning every $1 spent on ads needs to generate at least $4 in revenue just to cover costs, before any campaign is actually profitable.
Calculate Your Break Even ROAS →
What Is Break Even ROAS, and Why It’s More Useful Than Regular ROAS
Regular ROAS (Return on Ad Spend) just tells you the ratio of revenue to ad spend: a 3x ROAS means $3 in revenue for every $1 spent. What it doesn’t tell you is whether that $3 in revenue actually covered the cost of the product, the payment processing fee, shipping, returns, and everything else that eats into the sale before it becomes real profit.
Break even ROAS fixes that blind spot. It’s the specific ROAS number at which a campaign’s profit is exactly zero: not losing money, not making any either. Anything above that number is genuine profit; anything below it means the campaign is actively costing the business money, even while the ads dashboard shows “positive” returns. This is why performance marketers treat break even ROAS as the real baseline, not an arbitrary target pulled from an industry benchmark.
How to Calculate Break Even ROAS: The Formula
The core formula behind how to calculate break even ROAS is simple once you know your profit margin. It only needs one input:
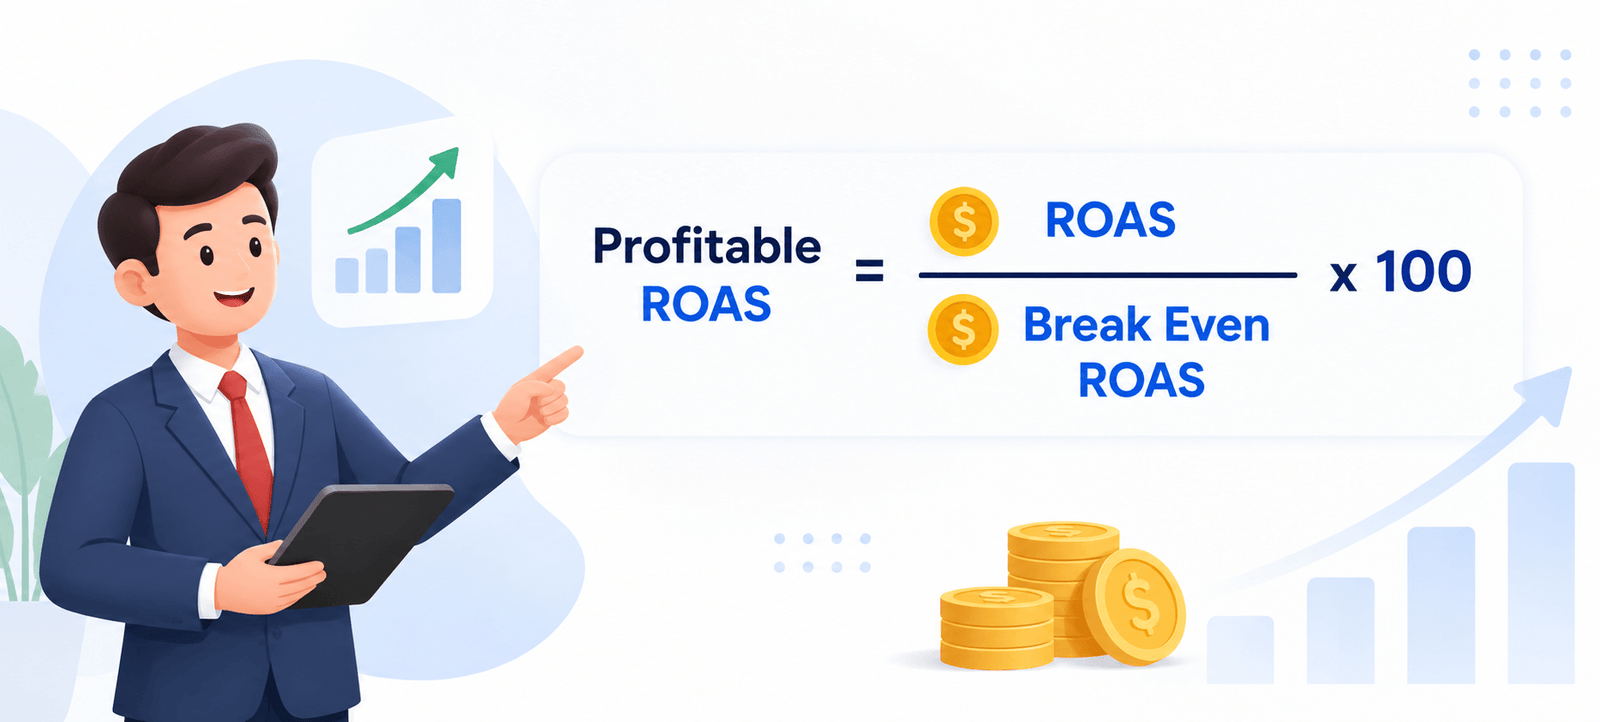
Profit margin here means gross margin: revenue minus the cost of goods sold (COGS), divided by revenue. It does not need to include ad spend itself, since ad spend is exactly what you’re solving for. If a product sells for $100 and costs $60 to produce and deliver, the gross margin is 40%, or 0.40 as a decimal.
Notice the pattern: the lower the margin, the higher the ROAS a campaign needs just to break even. This is exactly why a 20% margin business chasing the same “3x ROAS is good” advice as a 60% margin business can end up bleeding money on ads that look perfectly healthy in the dashboard.
Step-by-Step Example of Calculating Break Even ROAS
Numbers make this easier to see in practice. Here’s a full walkthrough using a real product example:
In plain terms: for every $1 spent on ads for this product, at least $2.50 in revenue needs to come back just to cover the cost of goods. If a campaign is currently running at a 3.2x ROAS, it’s genuinely profitable, since the gap between 2.5x and 3.2x is real margin. If it’s running at 2.1x, the ads are actively losing money on every sale, even though revenue is still coming in and the campaign “looks” active and functioning.
This is also where a lot of the confusion around how to calculate break even ROAS clears up: the formula stays the same regardless of order size, price point, or platform. Only the margin input changes from product to product, which is why break even ROAS should ideally be calculated per product or per product category, not as one blanket number for an entire store.
Break Even ROAS vs. Target ROAS: What’s the Difference
These two numbers get mixed up constantly, but they answer completely different questions. Break even ROAS answers “at what point does this campaign stop losing money?” Target ROAS answers “what return do I actually want, given my growth goals and how much profit I’m willing to reinvest?”
- Break even ROAS is a hard floor calculated directly from cost data. It’s math, not a goal, and it doesn’t change based on ambition.
- Target ROAS sits above break even by design, building in the actual profit margin the business wants to keep after ad spend is subtracted.
- A healthy target ROAS is usually break even ROAS plus a buffer. For a 2.5x break even, a realistic target might be 3.5x to 4x, depending on how aggressively the business wants to grow versus bank profit.
- Running campaigns exactly at break even ROAS technically avoids losses, but it also means zero profit is actually being generated from ad spend. That’s fine short-term for market-share plays, but unsustainable long-term.
What Affects Your Break Even ROAS Number
Break even ROAS isn’t fixed once and forgotten. Several cost factors shift it, sometimes significantly, and missing any of them means the “break even” number being used is actually wrong.
- Cost of goods sold. The single biggest lever, where even a small change in manufacturing or sourcing cost moves the break even ROAS noticeably.
- Payment processing fees. Typically 2-3% of revenue, and easy to forget when calculating margin by hand.
- Shipping and fulfillment costs. Especially relevant for e-commerce, where free-shipping offers quietly eat into margin without appearing as a separate line item.
- Return and refund rates. A product with a high return rate has a lower effective margin than its sticker-price margin suggests.
- Discounts and coupon usage. If a large share of sales come through a discount code, the real selling price, and therefore the real margin, is lower than the listed price.
A break even ROAS calculated once at the start of a product’s life and never revisited tends to drift out of date as these costs change. That’s exactly why it’s worth recalculating whenever a major cost input shifts, rather than treating it as a permanent number.
Common Mistakes When Calculating Break Even ROAS
Skip the Manual Math With a Break Even ROAS Calculator
Doing this by hand for one product is easy enough, but most businesses sell more than one SKU, at more than one price point, with margins that shift every time a supplier cost or shipping rate changes. Re-running the formula manually for each product, every time a cost input moves, gets tedious fast, and it’s exactly the kind of repetitive calculation that’s easy to get wrong under time pressure.
A dedicated Break Even ROAS Calculator handles the math instantly. Just enter the selling price and cost per unit, and it returns the exact break even ROAS along with the margin behind it. It’s a faster way to sanity-check a campaign before launch, or to re-check break even numbers across an entire product catalog after a pricing update.
Calculate Your Break Even ROAS →
Use It Before You Set a Campaign Budget
Running the numbers through the calculator before a campaign launches, not after a week of ad spend, is what actually prevents budget from being wasted on a ROAS target that was never realistic for the product’s margin in the first place.
Frequently Asked Questions
What is a good break even ROAS?
Is break even ROAS the same for every product?
Should I include ad spend when calculating the profit margin used in this formula?
How often should I recalculate break even ROAS?
What’s the difference between ROAS and break even ROAS?
Final Thoughts
Knowing how to calculate break even ROAS turns a vague “is this campaign doing well?” question into a precise, product-specific answer. Once the break even number is known for a product, every ROAS report becomes instantly readable: above the line is profit, below it is a loss, regardless of how the number looks compared to industry averages or a competitor’s screenshot. Calculate it per product, recalculate it whenever costs shift, and use it as the real floor for every ad budget decision going forward.