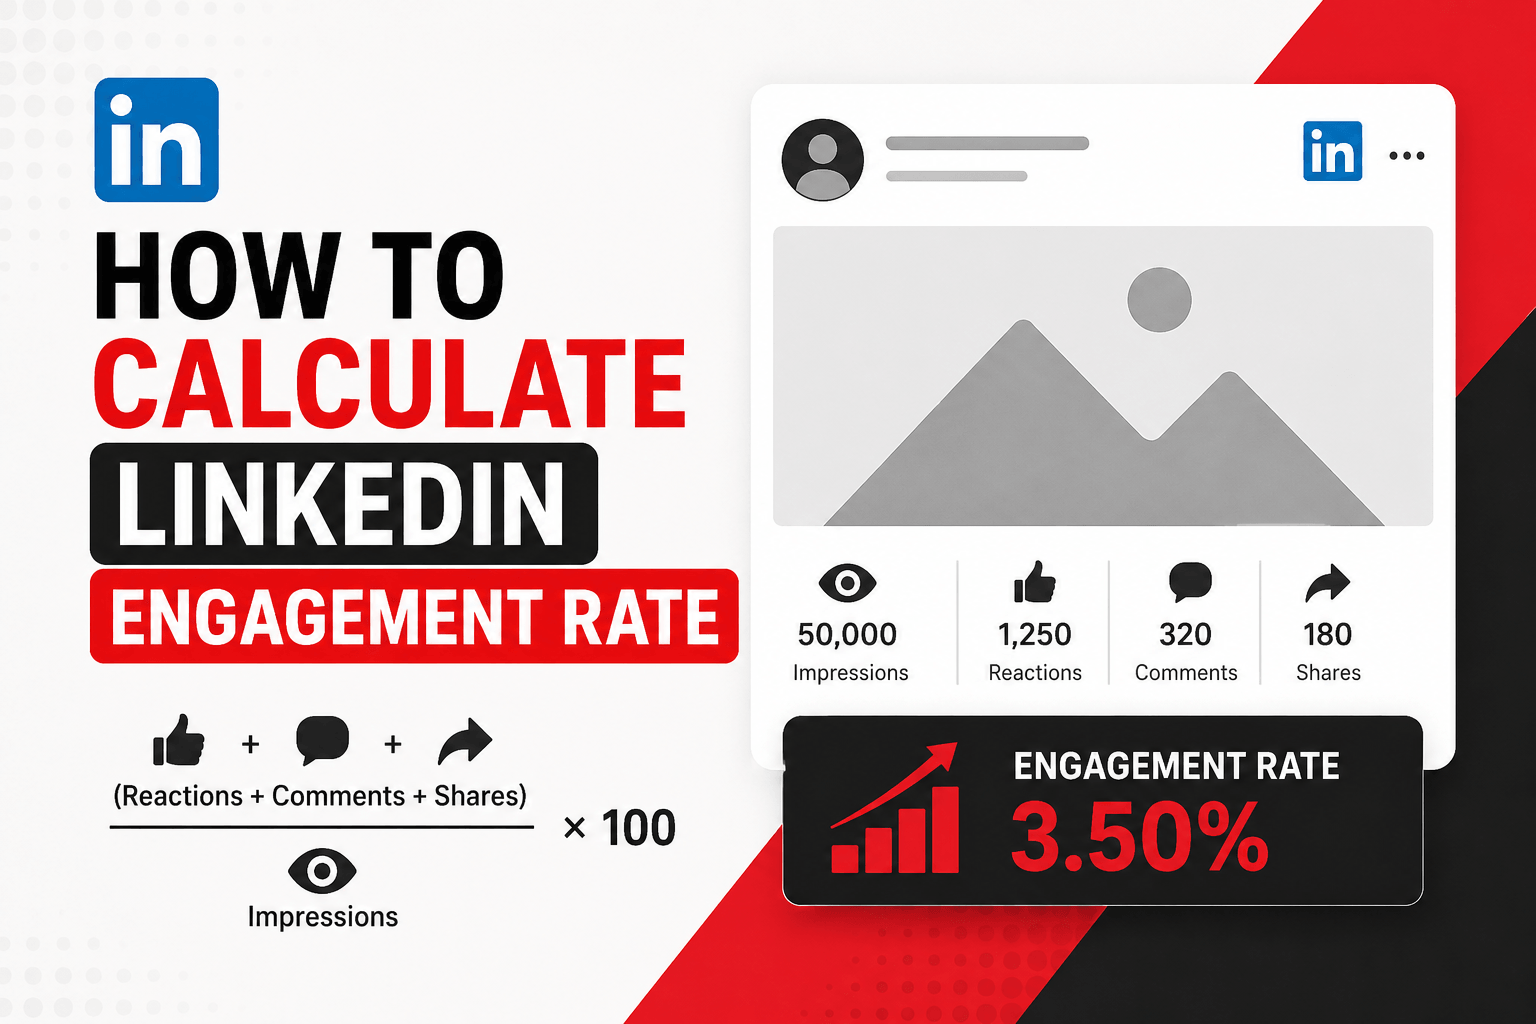
How to Calculate LinkedIn Engagement Rate
The formula, a worked example with real numbers, and what counts as a genuinely good result on a platform where the benchmarks look nothing like Instagram’s.
Vanity metrics are especially misleading on LinkedIn. A post with 50,000 impressions sounds impressive until you check whether anyone actually reacted, commented, or clicked — and on a platform built around professional relevance rather than viral entertainment, that gap between reach and genuine interaction matters more than almost anywhere else. Knowing how to calculate LinkedIn engagement rate is the fastest way to strip away the impression count and see what actually happened once people saw the content.
Calculate Your LinkedIn Engagement Rate →
Why Bother Learning How to Calculate LinkedIn Engagement Rate
Follower count and impressions are the numbers people naturally gravitate toward, since bigger feels better on the surface. But neither one tells you whether the content is actually working. A page with 20,000 followers and a 0.4% engagement rate is quietly underperforming a page with 2,000 followers and a 4% rate — the smaller audience is simply paying far more attention.
This matters practically for two reasons. First, LinkedIn’s own distribution system uses early engagement as a signal to decide how far to push a post beyond its initial audience — a post that earns strong engagement in its first hour tends to reach substantially more people than one that doesn’t, regardless of follower count. Second, engagement rate is one of the few metrics that stays comparable across accounts of wildly different sizes, making it genuinely useful for benchmarking against competitors or industry norms rather than just tracking your own raw numbers over time.
How to Calculate LinkedIn Engagement Rate: The Formula
LinkedIn engagement rate is most commonly calculated using impressions as the denominator, since LinkedIn provides that data natively for every post.
LinkedIn counts reactions (which include likes), comments, shares, and clicks as engagement. Some calculations also factor in follows gained directly from a post, since LinkedIn allows following a page or person without leaving the feed. According to Search Engine Land’s breakdown of LinkedIn engagement metrics, LinkedIn also uses viewable impressions rather than raw impressions — meaning only impressions that were actually visible on screen count, which tends to make the resulting engagement rate slightly higher than it would be under a raw-impression model.
An Alternative: Follower-Based Engagement Rate
A second version swaps impressions for follower count, which is useful when comparing engagement relative to audience size rather than reach on a specific post.
Neither version is universally “correct” — they answer different questions. Use the impression-based formula when deciding whether a specific post’s content and format worked. Use the follower-based version when tracking whether an account’s overall audience is becoming more or less engaged over months of posting, since follower count changes far more slowly than impressions from post to post.
A Worked Example With Real Numbers
Say a post received the following results after a week live:
Total engagement: 95 + 18 + 7 + 12 = 132. Divide by impressions: 132 ÷ 4,200 = 0.0314. Multiply by 100: 3.14% engagement rate — a solidly above-average result for LinkedIn, where anything over 2% is generally considered healthy.
Compare that to a second post from the same account with 12,000 impressions but only 140 total engagements. Even though this post reached nearly three times as many people, its engagement rate comes out to just 1.17% — noticeably weaker despite the larger raw numbers. Looking at impressions alone would suggest the second post performed better; the engagement rate tells the more accurate story.
Calculate Your Own Rate Free →
What Counts as a Good LinkedIn Engagement Rate
LinkedIn’s benchmarks run noticeably lower than consumer platforms like Instagram, since the audience and interaction patterns are fundamentally different. Professional audiences scroll with different intent — checking industry news or job-related updates rather than actively seeking entertainment — which naturally produces lower interaction volume relative to reach.
Rates of 10-20% do occur, but are frequently tied to engagement pods or coordinated artificial activity rather than genuine organic interest — a rate that looks too good relative to your typical performance is worth double-checking rather than celebrating outright. If a sudden spike doesn’t correspond to any change in your posting strategy, that mismatch itself is often the clearest signal something artificial is inflating the number.
Where to Find the Numbers You Need
Open Your Post or Page Analytics
For personal profiles, scroll to the private analytics module and click “View all analytics.” For company pages, use the “Content” or “Analytics” tab.
Locate the Post Analytics Table
Individual post performance data lists impressions alongside reactions, comments, shares, and clicks for each post separately.
Sum the Engagement Metrics
Add reactions, comments, shares, and clicks together for the specific post being analyzed to get total engagement.
Apply the Formula
Divide total engagement by impressions and multiply by 100 — or skip the manual math with a LinkedIn engagement rate calculator and just enter the raw numbers.
Early Engagement Matters More Than Total Engagement
LinkedIn’s distribution tends to work in waves — strong engagement within the first 60-90 minutes signals quality content and expands reach further. Tracking engagement rate consistently across posts reveals which formats and topics reliably earn that early response, which compounds into much larger total reach over time. This is why two posts can start with identical impressions in their first hour and end up with wildly different final reach a week later — the early signal, not the topic alone, decided how far each one traveled.
Mistakes People Make Learning How to Calculate LinkedIn Engagement Rate
Frequently Asked Questions
How to calculate LinkedIn engagement rate for a company page vs a personal profile?
What is a good LinkedIn engagement rate?
Why does LinkedIn’s engagement rate use impressions instead of followers?
Do follows count as engagement on LinkedIn?
Is a very high engagement rate always a good sign?
Should I calculate engagement rate per post or for my whole page?
Final Thoughts
Now that you know how to calculate LinkedIn engagement rate, use it to cut through impression counts and see what content genuinely resonated with a professional audience. Track it consistently across posts rather than judging any single result in isolation, compare against LinkedIn’s own benchmarks rather than other platforms, and treat unusually high rates with healthy skepticism rather than automatic celebration.