What Is a LinkedIn Engagement Rate Calculator?
A LinkedIn Engagement Rate Calculator is a free online tool that instantly measures how well your posts, updates, or company page content performs on LinkedIn. Instead of doing the math by hand, you simply enter your impressions, reactions, comments, shares, clicks, and follows — and the calculator returns your exact engagement rate as a percentage in seconds.
Whether you manage a personal profile, a LinkedIn company page, or multiple client accounts as a social media manager, this LinkedIn engagement rate calculator tool removes the guesswork and gives you a precise, comparable number you can act on. It is one of the many free tools available at onlinetoolix.
The LinkedIn Engagement Rate Formula
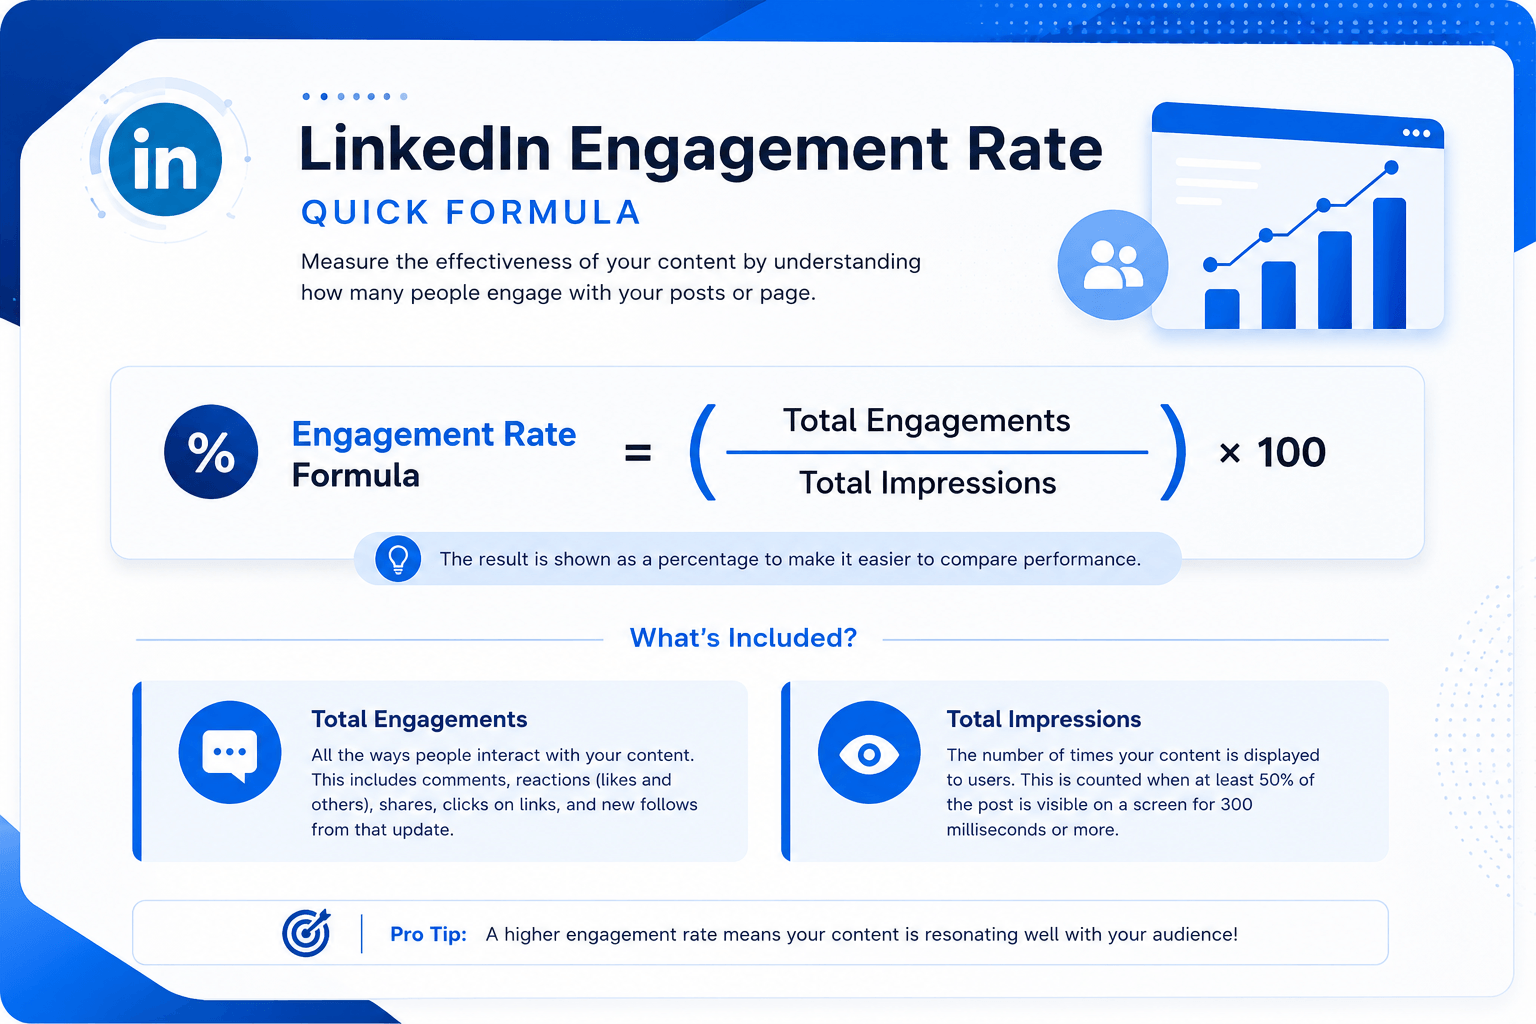
The official LinkedIn engagement rate calculator formula used by LinkedIn's own analytics platform is:
Where Total Engagements = Clicks + Comments + Reactions (Likes, Celebrate, Support, Insightful, Funny, Love) + Shares/Reposts + Follows.
LinkedIn counts an impression only when a post is more than 50% visible on screen for over 300 milliseconds — a stricter viewability standard than most social platforms.
There is also a follower-based variant:
Use the impressions-based formula when you have access to LinkedIn Analytics (recommended for accuracy). Use the follower-based formula for quick estimates when impressions data isn't available — for example, when analysing a competitor's LinkedIn profile engagement rate from a public post.
How to Use This LinkedIn Engagement Rate Calculator
Our free LinkedIn engagement rate calculator online has three calculation modes:
Enter your clicks, comments, reactions, shares, and follows individually (or input a total engagements figure directly), then add your impressions. Hit Calculate and your engagement rate appears instantly alongside a performance grade.
Already know your engagements and have a target engagement rate you want to hit? This mode works backwards to tell you exactly how many impressions your post needs to achieve that goal.
Know your expected impressions and a target rate? This mode calculates the exact number of engagements you need. Perfect for setting realistic campaign KPIs before a post goes live.
No login. No signup. No credit card. This is a fully free LinkedIn engagement rate calculator — use it as many times as you need. For tracking your broader content performance, also use our Word Counter and Reading Time Calculator to optimise post length before publishing.
What Counts as an Engagement on LinkedIn?
LinkedIn counts five types of interactions as engagements. Understanding each one helps you input accurate numbers into any LinkedIn post engagement rate calculator:
| Engagement Type | What It Includes |
|---|---|
| Reactions | Like, Celebrate, Support, Love, Insightful, Funny |
| Comments | Direct replies to your post |
| Shares / Reposts | Reshares to a connection's feed |
| Clicks | Clicks on links, images, or the post itself |
| Follows | New followers gained directly from an update |
One important nuance: if you 'like' an update from your own company page with your personal profile, that reaction counts toward your reactions total — but LinkedIn excludes it from the official engagement rate calculation in the sponsored stats view.
LinkedIn Engagement Rate Benchmarks 2026
Knowing your number is only half the picture. The real value of a LinkedIn average engagement rate calculator is benchmarking your result against industry standards. According to Socialinsider's Q1 2026 LinkedIn Benchmarks Report, here is what the data shows:
Platform-Wide Averages
Personal Profiles
3.85% average engagement rate across the platform in Q1 2026.
Company Pages
2.1% average engagement rate. Above 5% for a company page is genuinely excellent.
Platform Median
4.7% across all content types in Q1 2026 — up 22% year-over-year.
Top Performers
10%+ engagement rate puts you in the top 5% of creators, with algorithm-favoured content.
What Your Rate Means
| Engagement Rate | What It Means |
|---|---|
| Below 1.5% | Below average — content or targeting needs work |
| 1.5% – 3.85% | Average — solid baseline, room to grow |
| 4% – 6% | Good — above platform average, strong content strategy |
| 6% – 10% | Excellent — top 10% of creators |
| 10%+ | Elite — top 5%, algorithm-favoured content |
By Content Format
| Format | Average Engagement Rate |
|---|---|
| Carousels / Multi-image posts | 6.6% – 7% (highest of all formats) |
| Native documents | 5.85% – 6.1% |
| Image posts | 3.49% – 5% |
| Video posts | 2% – 5.6% |
| Text-only posts | 2% – 4% |
| Polls | 5% – 10% |
By Industry (2026)
| Industry | Average Engagement Rate |
|---|---|
| Recruiting & HR | 5%+ (highest of all industries) |
| B2B SaaS & Technology | 4.5% – 5.5% |
| Healthcare & Biotech | 3.0% – 4.2% |
| Education | 3.0% – 4.0% |
| Professional Services | 3.2% |
| Financial Services | 3.2% |
| Retail & E-commerce | 2.5% – 3.9% |
By Page / Profile Size
| Follower Count | Typical Engagement Rate |
|---|---|
| Under 1,000 followers | 5% – 10% |
| 1,000 – 10,000 followers | 2% – 5% |
| 10,000 – 50,000 followers | 1% – 3% |
| 50,000+ followers | 0.5% – 2% |
Smaller accounts almost always outperform larger ones on a per-impression basis. Don't be discouraged by a lower absolute number — if you have 500 followers and 6% engagement, you are performing exceptionally well.
LinkedIn Page Engagement Rate vs. Post Engagement Rate — What's the Difference?
Many users ask whether to use a LinkedIn page engagement rate calculator or a LinkedIn post engagement rate calculator. Here is the key distinction:
Post Engagement Rate
Measures the performance of a single update using individual post-level impressions and engagements. This is the most precise and actionable metric — it tells you exactly which pieces of content resonate with your audience. Use this for day-to-day content optimisation.
Page Engagement Rate
An average across all your posts over a date range. LinkedIn calculates this automatically in the Followers → Companies to Track section of your analytics. Useful for monthly reporting, competitive benchmarking, and tracking trends over time.
LinkedIn Account Engagement Rate: Personal Profiles vs. Company Pages
When tracking your LinkedIn account engagement rate, the type of account matters significantly.
Personal profiles consistently outperform company pages — typically by 2x to 5x — because LinkedIn's algorithm is built around human-to-human connections. People engage with people, not logos. A founder or marketer sharing personal insights, behind-the-scenes stories, or honest opinions will almost always generate a higher engagement rate than the same content posted from a brand account.
Company pages average 2.1% engagement in 2026. If your LinkedIn page engagement rate calculator result sits between 2% and 5%, you are performing in line with or above the brand average. Above 5% for a company page is genuinely excellent.
Practical implication: If you manage both a personal profile and a company page, benchmark them separately. Do not compare a personal profile's 5% rate against a company page's 2.1% rate — they operate in entirely different algorithmic environments.
How to Find Your LinkedIn Stats for This Calculator
LinkedIn shows impressions, reactions, and comments directly beneath each post in your feed. Click the reaction/comment count to expand stats. Note: LinkedIn personal analytics do not natively show clicks, shares, or follows per post — for a complete LinkedIn profile engagement rate calculator input, you will need to estimate or use a third-party analytics tool.
Go to your company page → find the update → click "Show stats" at the bottom. This reveals full organic stats: impressions, clicks, reactions, comments, shares, and follows. These numbers feed directly into the calculator above.
Go to Analytics → Updates on your company page. Scroll down to "Update engagement" to see per-post stats, or click Export in the top-right to download a full spreadsheet. The exported file includes engagement rates pre-calculated in the furthest right columns.
Go to Analytics → Followers → Companies to track. Your page appears first. Select a date range and your overall engagement rate is shown — covering both sponsored and organic posts.
Why This LinkedIn Engagement Rate Calculator Beats Alternatives
There are several tools in this space — from the Phlanx LinkedIn engagement rate calculator to platform-native analytics dashboards. Here is why this tool is worth bookmarking:
No subscription, no free trial, no email capture. Use it unlimited times without creating an account.
Most free tools only calculate ER. Ours also works backwards: find required impressions or required engagements to hit any target rate. Ideal for campaign planning.
Built around LinkedIn's official formula (engagements ÷ impressions × 100), not a generic social media formula. The inputs match exactly what LinkedIn reports.
Results appear immediately. No loading screens, no redirects.
Clicks, comments, reactions, shares, and follows all have dedicated input fields, giving you a more precise result than tools that only accept a single "engagements" number.
Whether you need a LinkedIn post engagement rate calculator for a single update or a LinkedIn page engagement rate calculator for monthly reporting, this tool handles both.
7 Proven Ways to Improve Your LinkedIn Engagement Rate
If your results from the LinkedIn engagement rate calculator are lower than you'd like, here are the highest-impact improvements based on 2026 data:
Carousels achieve 6.6%–7% average engagement — the highest of any format. If you are only posting text or single images, this format shift alone can double your rate.
Timing affects reach, and reach affects your impression denominator. Peak-time posting maximises total interactions and keeps your engagement rate competitive.
Comments carry far more algorithmic weight than reactions. A single genuine question at the end of your post consistently lifts comment rates, driving the algorithm to extend reach — creating a compound effect on engagement rate.
LinkedIn's algorithm treats your replies as additional engagement signals on the post. Rapid response in the golden window keeps posts in feeds longer and drives the overall rate higher.
Personal profiles receive 2x–5x more organic reach. If you are a founder, executive, or marketer, your personal voice will consistently outperform your brand account.
LinkedIn truncates posts at roughly 3 lines with a "See more" link. The hook is everything — it determines whether users expand the post, which counts as a click engagement.
Hashtag stuffing reduces the quality signal. Three to five niche hashtags that match your content get your post in front of a smaller but more relevant audience, improving both impressions quality and engagement rate.
Frequently Asked Questions
Whether you manage a personal profile, a company page, or a full roster of client accounts, your LinkedIn engagement rate is the single clearest signal of how well your content is working. This free calculator gives you that number instantly — in three modes, with no sign-up required.
Run your numbers, compare them against the 2026 benchmarks, and use the seven improvement tips to move the needle. Combine this tool with our Word Counter and Reading Time Calculator to optimise your post length before publishing — all free on Onlinetoolix.
This LinkedIn Engagement Rate Calculator is built for marketers, content creators, and social media managers who want real data — not guesswork. Use it regularly to benchmark your performance, track growth over time, and make smarter decisions about the content you create and publish on LinkedIn.