What Is a Twitter Engagement Rate Calculator?
A Twitter Engagement Rate Calculator is a free online tool that instantly measures how well your tweets are performing — expressed as a clean, actionable percentage. Instead of manually dividing numbers every time you review a post, you enter your likes, replies, reposts, bookmarks, and link clicks, choose a denominator (impressions or followers), and your engagement rate appears in seconds.
Whether you manage a personal creator account, a brand handle, or dozens of client profiles, this Twitter engagement rate calculator cuts through the vanity metrics and gives you the one number that actually tells you whether your content is connecting — your engagement rate. It is one of the many free tools available at onlinetoolix.
Why Engagement Rate Is the Most Important Twitter Metric
Impressions tell you how many times a tweet was displayed. Follower count tells you how big your audience is. Neither tells you whether anyone actually cared.
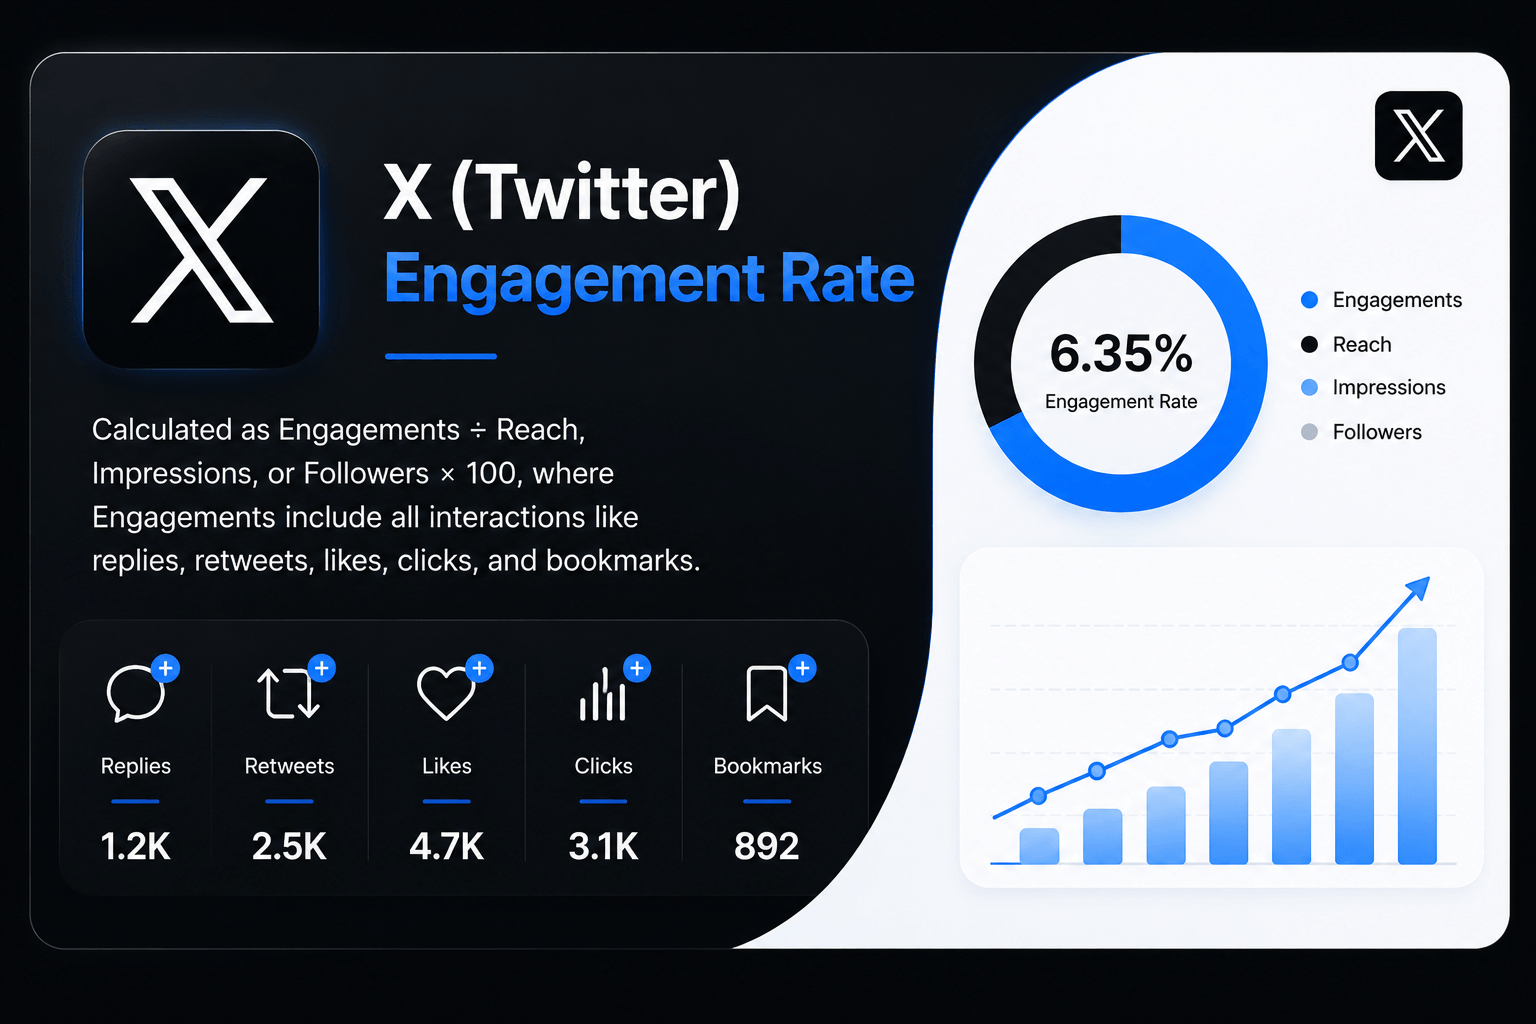
Engagement rate is different. It measures the percentage of people who saw your tweet and chose to do something — like it, reply to it, repost it, bookmark it, or click through. It is the clearest signal of content quality available in Twitter analytics, and it is the metric Twitter's own algorithm uses to decide whether to amplify your content further.
Signal vs. Noise: A tweet with 50,000 impressions and 50 engagements performed worse than a tweet with 1,000 impressions and 30 engagements.
50,000 impressions / 50 engagements = 0.10% ER — noise 1,000 impressions / 30 engagements = 3.00% ER — signalThe second tweet resonated. Every time you use a Twitter engagement rate calculator, you are separating signal from noise.
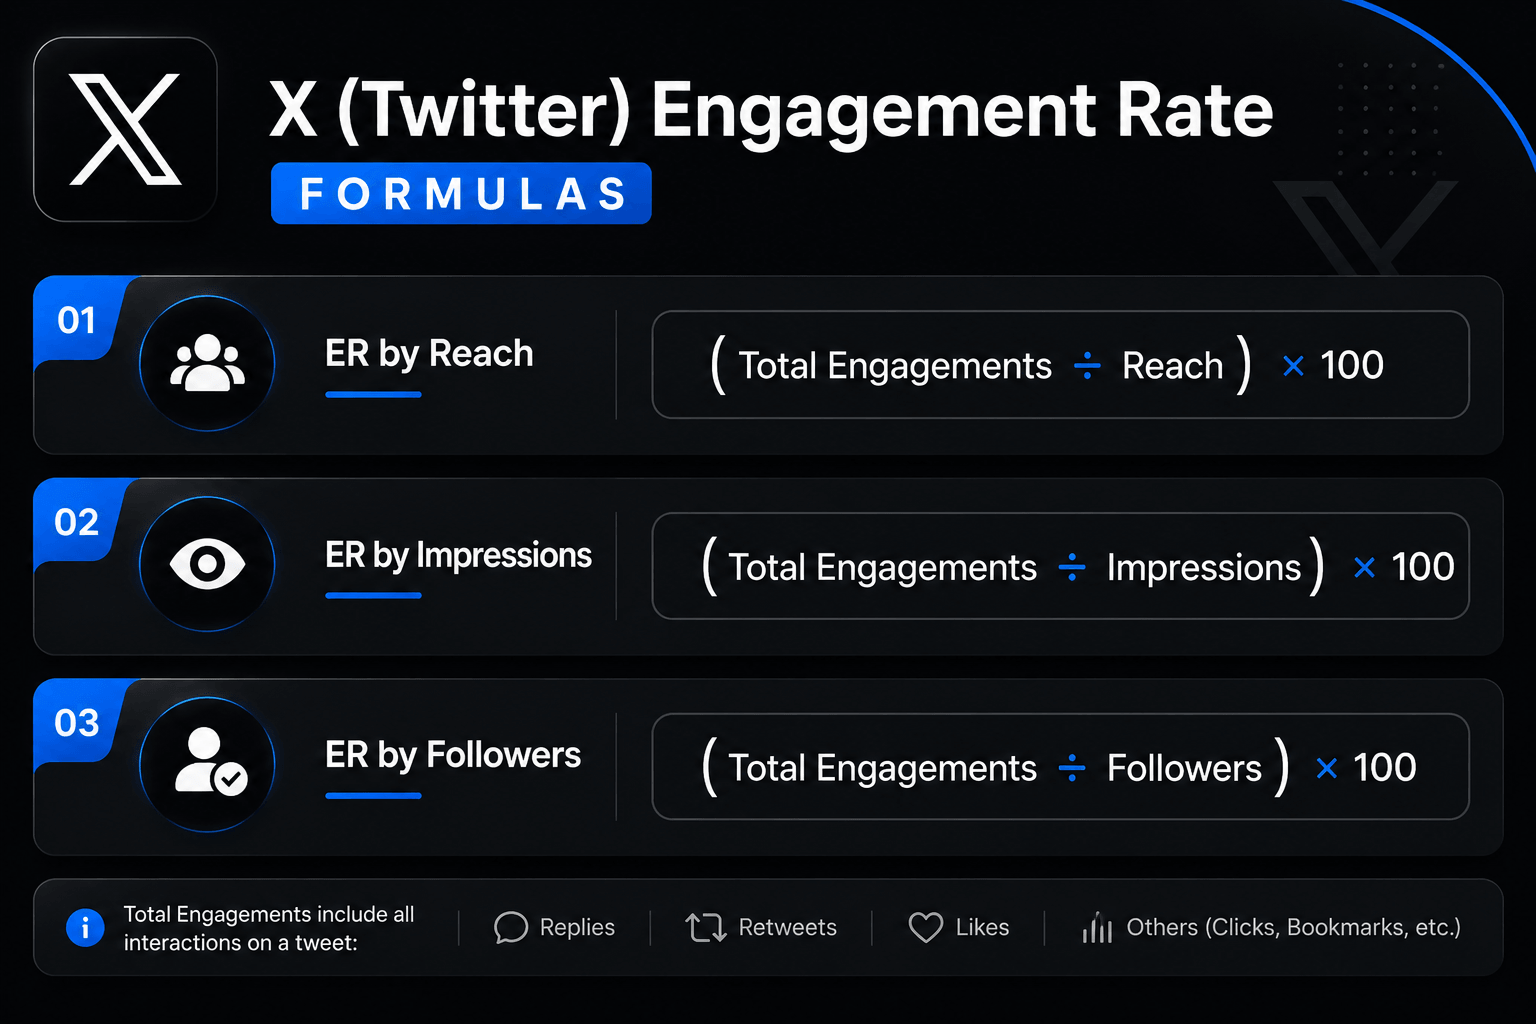
The Twitter Engagement Rate Formula
There are two accepted formulas for calculating Twitter engagement rate, and understanding which one to use — and when — is critical to interpreting your numbers correctly.
This is the most accurate per-tweet measurement and the formula most industry benchmark reports are based on. Impressions represent the actual number of times your tweet was displayed — whether in a follower's home timeline, a search result, or X's "For You" feed. This is the formula our tool defaults to, because it matches what X's native Twitter analytics dashboard reports.
This formula divides engagements by your total follower count, regardless of how many followers actually saw the tweet. It is the standard formula used for competitor research and external benchmarking — because you can always see someone's follower count, even when you cannot see their impressions.
Use Impressions-Based ER When...
Evaluating your own tweet performance — it is the most precise and directly actionable metric for day-to-day content optimisation.
Use Follower-Based ER When...
Competitor analysis, influencer vetting, or standardised monthly reporting where consistency across accounts matters more than precision.
What Counts as an Engagement on Twitter / X?
To use any Twitter metrics calculator accurately, you need to know exactly which interactions X counts as engagements. Unlike simpler platforms, X tracks a notably wide range of actions:
| Engagement Type | What It Includes |
|---|---|
| Likes | Heart reactions on your tweet |
| Replies | Direct replies to your tweet |
| Reposts | Standard retweets and quote tweets combined |
| Bookmarks | Saves to a user's reading list (visible since 2023) |
| Link Clicks | Clicks on URLs embedded in your tweet |
| Profile Clicks | Clicks on your username, avatar, or display name |
| Detail Expands | Clicks on "Show more" or opening a tweet's detail view |
| Media Clicks | Clicks on images, GIFs, or video plays |
Important on bookmarks: X made public bookmark counts visible in 2023, making them a uniquely powerful signal — someone bookmarked your tweet specifically because they found it valuable enough to save. Our calculator includes a dedicated bookmarks field because most generic tools still omit this metric, producing understated results.
Note on "For You" impressions: X's "For You" feed now surfaces tweets to non-followers at scale. This means impressions can be significantly higher than your follower count — especially for accounts posting viral or trending content. If your impressions look unusually high, this is likely the cause, and it will naturally compress your impressions-based engagement rate. This is structural, not a reflection of poor content quality.
How to Use This Twitter Engagement Rate Calculator
Our free Twitter engagement rate calculator online works in three modes — making it more versatile than a standard twitter engagement checker that only calculates in one direction.
Enter your likes, replies, reposts, bookmarks, link clicks, and profile clicks (or a single total engagements figure). Select whether you want to calculate by impressions or followers. Hit Calculate and your engagement rate appears instantly with a 2026-benchmarked performance grade.
Working backwards from a target engagement rate: enter your total engagements and the ER you want to achieve. The calculator tells you exactly how many impressions (or followers) you need to hit that goal — useful for campaign planning and setting realistic pre-launch KPIs.
Enter your expected impressions and a target ER. The calculator outputs the exact number of engagements needed to achieve it. Ideal for briefing content teams or setting post-level performance targets before publishing.
No login. No subscription. This is a completely free Twitter engagement rate calculator — use all three modes as many times as you need. Pair it with our LinkedIn Engagement Rate Calculator and Facebook Engagement Rate Calculator for cross-platform reporting.
How to Find Your Twitter Metrics
To get accurate numbers for this Twitter metrics calculator, you need to know where to find your data in X's native analytics.
The full Twitter analytics dashboard is available at analytics.twitter.com — or via your profile menu → Creator Studio → Analytics on desktop. As of 2026, full access to historical data and deep metrics requires an X Premium subscription.
Click on any of your tweets → tap the chart icon or "View post analytics" at the bottom. You will see impressions, likes, replies, reposts, bookmarks, and link clicks for that specific tweet. This data is available without Premium — it is just not aggregated into a dashboard view.
Premium users can access the full dashboard at analytics.twitter.com, which shows 28-day summary data, top tweets by impressions, engagement rate trends, follower growth, and video activity. You can also export raw CSV files from the Account Home or post analytics dashboard for bulk analysis.
If you do not have X Premium, third-party tools like Fedica, Sociality.io, or TweetArchivist offer basic impression tracking for free accounts. These tools pull publicly available data and can supplement native analytics.
You cannot see another account's impressions without access to their analytics. Use the follower-based formula and count engagements manually (or via a twitter engagement checker tool) to calculate an external engagement rate.
Twitter Engagement Rate Benchmarks 2026
Once you have your number from the Twitter Engagement Rate Calculator, here is how to interpret it against 2026 platform data. X has the lowest average engagement rate of any major social platform, sitting around 0.10% in 2026 when measured by followers — but by impressions, the average jumps to 1–3%.
Critical context: A 0.5% rate on X represents comparable audience engagement to a 2–3% rate on other platforms — because X's timeline moves faster, passive consumption is higher, and the friction to engage is lower on platforms like Instagram or TikTok. Do not compare your X rate directly against your Facebook or Instagram numbers.
What Your Rate Means (By Impressions — Recommended)
| ER by Impressions | Performance Level |
|---|---|
| Below 0.5% | Below average |
| 0.5% – 1.5% | Average |
| 1.5% – 3.0% | Good — above platform norm |
| Above 3.0% | Excellent — top performing content |
By Content Format (2026)
| Format | Typical ER by Impressions |
|---|---|
| Text-only Threads (strong hook) | 2% – 5% |
| Polls | 1.5% – 3% |
| Native Video / Short-form | 1% – 2.5% |
| Single Image | 0.5% – 1.5% |
| Single Text Tweet | 0.3% – 1.5% |
| Link-only Tweets | Below average |
Across All Major Platforms (By Followers, 2026)
| Platform | Average ER by Followers (2026) |
|---|---|
| TikTok | 2.0% – 4.86% |
| 2.1% – 3.85% | |
| 0.45% – 0.60% | |
| 0.15% – 0.60% | |
| Twitter / X | 0.03% – 0.12% |
Twitter's number looks low in isolation — but that is a structural characteristic of the platform, not a reflection of content quality. Use a Twitter Engagement Rate Calculator to track your own trend over time rather than comparing raw percentages across platforms. For a full cross-platform view, also use our LinkedIn Engagement Rate Calculator and Facebook Engagement Rate Calculator.
X Engagement Rate Calculator vs. Twitter Engagement Rate Calculator — Are They the Same?
Yes. The X engagement rate calculator and Twitter Engagement Rate Calculator are the same tool applied to the same platform — X is simply the rebranded name for Twitter, adopted in 2023. The engagement formula has not changed, the analytics dashboard still displays the same metrics, and most marketers still search for "Twitter engagement rate" even when they mean X.
Our tool uses both names because your data, your formula, and your benchmarks are identical regardless of which name you use. Whether you call it a Twitter calculator or an X engagement rate calculator, the math is the same:
The denominator is either impressions (recommended for own account analysis) or followers (recommended for competitor benchmarking).
Why This Twitter Engagement Rate Calculator Beats Other Tools
No account, no email, no subscription. Unlike tools that gate features behind a free trial, every mode of this calculator is available immediately.
Likes, replies, reposts, bookmarks, link clicks, and profile clicks all have dedicated fields. Most free calculators only take a single "engagements" number, which produces less accurate results.
Most twitter engagement checker tools were built before X made bookmark counts public. Ours includes bookmarks, matching exactly what X Analytics reports.
Toggle between impressions-based and follower-based ER in one tool. Switching between them requires no page reload.
Calculate your current ER, find required impressions to hit a target rate, or find required engagements to hit a target rate. No other free tool offers all three modes for Twitter in one place.
Every result is graded against current platform data, not outdated standards from 2022 or 2023.
Twitter vs. Facebook Engagement Rate — Key Differences
If you also use our Facebook engagement rate calculator, you may notice your Twitter numbers look quite different. Here is why — and how to interpret the gap:
The Facebook engagement rate calculator defaults to reach (unique people who saw the post), which Facebook natively reports. Twitter/X reports impressions (total displays, including repeat views) as its primary metric. These produce different percentage outputs even for similar actual engagement levels.
Twitter's timeline moves significantly faster than Facebook's feed. Users scroll through dozens of tweets per minute, making the friction to engage higher and passive consumption more common. A 1% engagement rate on Twitter represents genuinely strong content — equivalent in real-world impact to a 3%–4% rate on Facebook.
Twitter uniquely includes profile clicks, detail expands, and bookmarks in its engagement count. Facebook does not track these in the same way. If you use both calculators for cross-platform reporting, standardise your inputs — use only reactions, comments, and shares for Facebook; use only likes, replies, and reposts for Twitter — to keep the comparison fair.
8 Proven Ways to Improve Your Twitter Engagement Rate
If your results from the Twitter Engagement Rate Calculator are lower than the benchmarks above, here are the highest-impact improvements supported by 2026 data:
Text-only threads achieve 2–5% engagement rate when the hook is strong. A thread with a compelling first tweet as the hook keeps readers engaged for multiple interactions — each one counted as an additional engagement signal.
Polls achieve 1.5%–3% engagement rates on X in 2026 — consistently above average. They are the lowest-friction engagement type: a single tap to vote. Polls also generate replies from people who want to explain their vote, compounding the engagement further.
Short-form video has surpassed text-based posts on X, with 37% of users most likely to interact with short-form video from brands. Upload video directly to X rather than sharing YouTube or external links — native video gets significantly more algorithmic reach than link posts.
X's algorithm treats replies to your own tweet as additional engagement signals, extending the tweet's reach window. A tweet with 10 comments that generates 10 author replies shows 20 comment-level interactions — double the algorithmic weight.
Only use 1–2 hashtags per tweet for optimal engagement. Alternate between broad, popular hashtags and niche, industry-specific ones. Tweets with 3+ hashtags consistently underperform those with 1–2 focused tags.
Use Twitter analytics (Creator Studio → Analytics) to identify when your specific followers are most active. Generic advice points to weekdays between 8am–10am and 12pm–1pm — but consistency of posting matters more than hitting a specific time window on X.
Engagement does not happen without a prompt. End threads with a direct question. Ask followers to repost if they agree. Request specific replies ("Comment with your answer below"). The more specific your CTA, the higher your reply and repost rates.
X content moves fast. A tweet that underperforms in the first two hours rarely recovers. Weekly tracking allows you to identify patterns quickly — which topics, formats, hooks, and posting times consistently generate above-average rates — and double down on what works before trends shift.
Frequently Asked Questions
Engagement rate is the clearest signal of whether your Twitter/X content is working — and this free calculator gives you that number instantly, across two formulas and three calculation modes, with no sign-up required.
Run your numbers, compare them against the 2026 benchmarks, and use the eight improvement strategies to move the needle. For a complete cross-platform view of your social media performance, combine this tool with our LinkedIn Engagement Rate Calculator, Facebook Engagement Rate Calculator, and Cost Per Click Calculator — all free on Onlinetoolix.