
Quick Answer
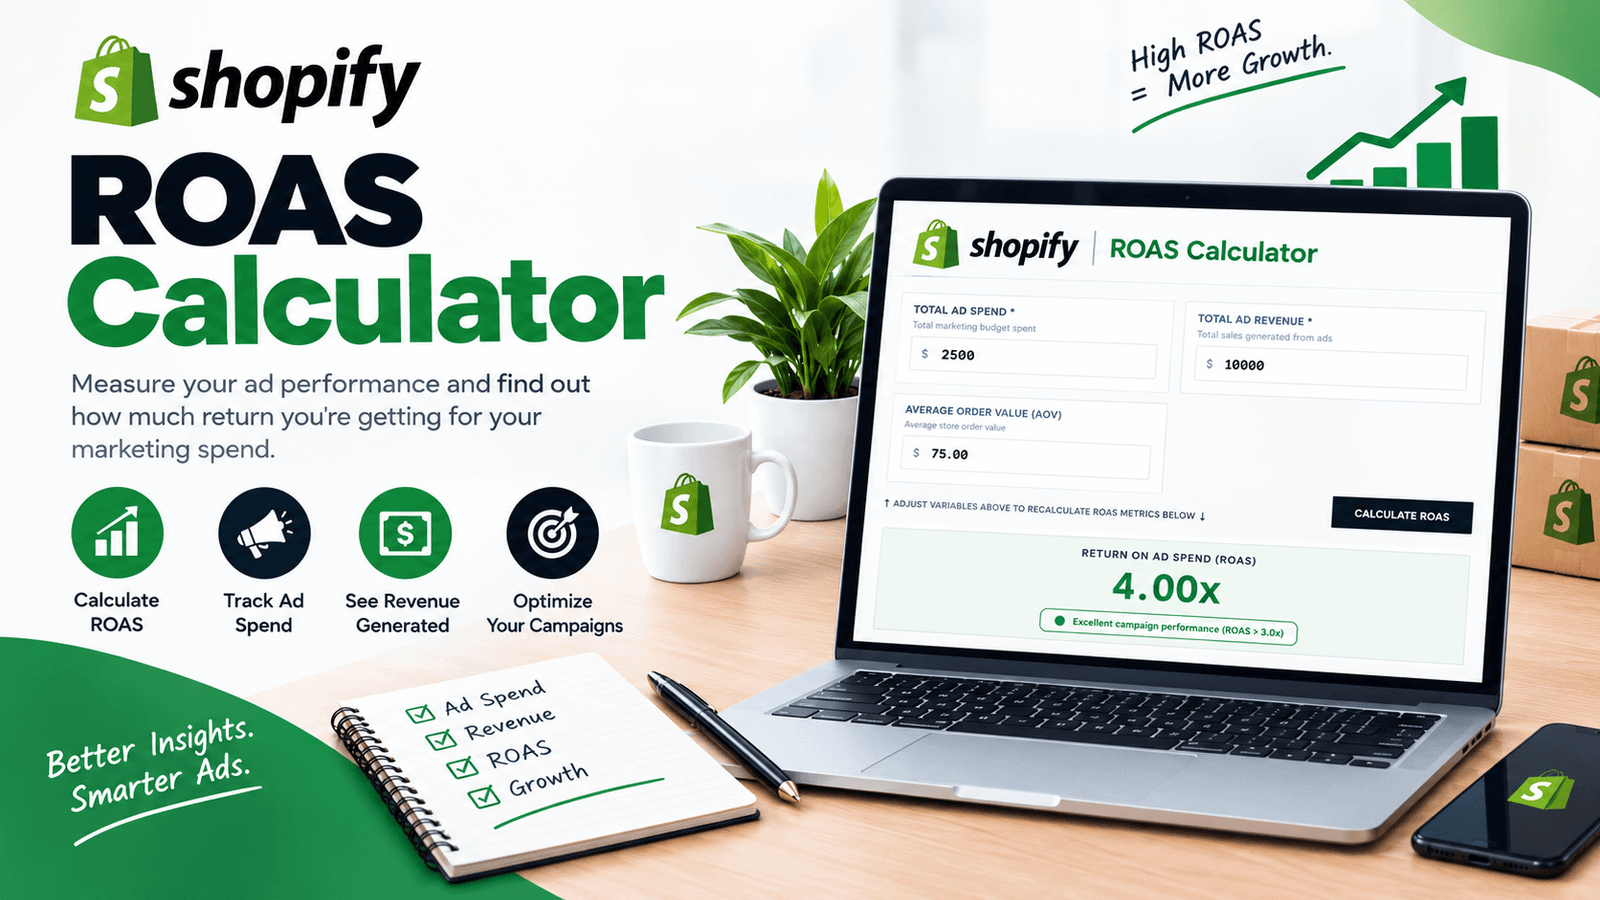
ROAS (return on ad spend) is the revenue your ads generate divided by what you spent on them. If you spent $2,500 on ads and they produced $10,000 in sales, your ROAS is 4.00x, meaning $4 of revenue for every $1 of ad spend. Our Shopify ROAS Calculator does that division for you instantly and adds an estimated order count, so you can see where a campaign stands in a few seconds.
Shopify ROAS Calculator — Free Online Tool
Most Shopify merchants check ROAS more often than almost any other advertising number, and for good reason: it's quick to read and it ties spend directly to sales. The trouble is that a ROAS figure on its own can mislead. A "good-looking" 4x can still lose money on a low-margin product, and a modest 2x can be perfectly healthy on a high-margin one.
This page explains how ROAS works, how to use the Shopify ROAS Calculator on this page, and, most importantly, how to decide whether your result is actually good for your store. If you also run paid search, compare results with our Google Ads ROAS Calculator.
What Is ROAS, in Plain Terms?
ROAS stands for return on ad spend. It measures gross revenue earned per unit of currency spent on advertising. The formula is:
It is expressed as a multiplier (4.00x) or sometimes as a ratio (4:1). Two things are worth knowing about it:
- It only counts advertising cost. Product costs, shipping, payment fees, and overhead are not part of the formula.
- It only counts revenue attributed to the ads. How that attribution is measured depends on the ad platform and your tracking setup, so the number is only as reliable as your tracking.
How the Shopify ROAS Calculator Works
The tool needs just three inputs, and it updates the moment you change any of them:
The amount you spent on the campaign or period you're reviewing.
The sales attributed to those ads.
Your typical order size, used to estimate how many orders the ad revenue represents.
You then see four results: your ROAS, the ad revenue generated, your total ad spend, and an estimated order count. A short color-coded message summarizes the result, and a second tab, the ROAS Guide, covers the formula, break-even ROAS, and when scaling is reasonable.
A Worked Example
Say you spend $2,500 on a campaign and your ads are credited with $10,000 in revenue. Your average order value is $75.
- ROAS: $10,000 ÷ $2,500 = 4.00x
- Estimated orders: $10,000 ÷ $75 ≈ 133 orders
- Revenue minus ad spend: $10,000 − $2,500 = $7,500
That last figure is worth reading carefully. The calculator labels it "Net Ad Profit," but it is simply ad revenue minus ad spend. It does not subtract what the products cost you, shipping, or payment fees, so it is not true profit. Think of it as the revenue left over after paying for the ads, which is exactly what ROAS is designed to measure.
Is a 4x ROAS Actually Profitable?
Not necessarily, and this is the most common mistake merchants make with the metric. Whether a ROAS is profitable depends on your margin, specifically the margin you keep after product costs, shipping, and fees but before ad spend.
The break-even ROAS is a simple calculation:
| Margin before ad spend | Break-even ROAS |
|---|---|
| 50% | 2.0x |
| 40% | 2.5x |
| 30% | 3.33x |
| 25% | 4.0x |
Now apply that to the example above. At a 25% margin, $10,000 in revenue leaves $2,500 after product costs and fees, which is exactly what you spent on ads. A 4.00x ROAS in that situation means you broke even, with nothing left over. At a 50% margin, the same 4.00x leaves $5,000 against $2,500 of ad spend, so you are well in profit. Same ROAS, completely different outcome.
If you want the break-even figure calculated from your actual per-unit costs, including VAT, use our Break Even ROAS Calculator alongside this one.
What Is a Good ROAS for a Shopify Store?
There is no single number that is good for every store. A useful way to think about it:
- Below your break-even ROAS: the campaign is losing money on each sale, before counting overhead.
- Around your break-even ROAS: you are covering costs but not building a profit.
- Comfortably above it: there is room to keep a profit and, if the trend holds, room to consider increasing spend.
The color-coded verdicts in this tool use general rules of thumb: 3.0x or higher is flagged as strong, 1.5x to 3.0x as moderate (check your margins), and below 1.5x as low. Treat those as a starting point for a quick read, not as a verdict on your business. Your own break-even ROAS is the benchmark that matters.
ROAS vs ROI: What's the Difference?
The two get mixed up constantly:
- ROAS measures how much revenue your advertising produces per dollar of ad spend. It is a tactical, campaign-level metric.
- ROI measures profit relative to total investment, so it accounts for product costs, shipping, fees, and other expenses, not just ads.
A campaign can have a healthy-looking ROAS and a poor ROI if margins are thin. For a fuller picture of store profitability, pair ROAS with a profit calculation, such as our Shopify Profit Margin Calculator. And to see how many sales you need each month just to cover your fixed costs, try the Shopify Break Even Calculator.
Who Gets the Most Out of a Shopify ROAS Calculator?
Store Owners Reviewing a Campaign
A quick check of whether last week's spend earned its keep, without opening a spreadsheet.
Media Buyers Comparing Channels
Run the same two numbers for Meta, Google, and TikTok separately to see where spend is returning the most revenue.
Agencies Preparing Client Reports
A clear ROAS figure and order estimate, calculated the same way every time.
Merchants Planning a Budget
Work backwards from a target ROAS to see what revenue a given spend would need to produce.
Anyone New to Paid Ads
The built-in guide explains the formula and break-even logic in plain language. Dropshippers can also model per-item economics with our Dropshipping Profit Margin Calculator.
Ways to Improve Your ROAS
ROAS has two levers, revenue and spend, and most improvements come from moving one without hurting the other.
- Raise average order value. Bundles, minimum-order incentives for free shipping, and relevant add-ons mean each ad-driven order is worth more, so the same spend returns more revenue.
- Improve conversion rate. A clearer product page, faster load times, and a smoother checkout turn more of the traffic you've already paid for into orders.
- Tighten targeting and creative. Review which audiences and ads actually produce sales, and shift budget away from the ones that don't.
- Check your tracking. If your ad platform's reported revenue doesn't match your Shopify orders for the same period, fix that first. Decisions made on bad attribution data can push you the wrong way.
- Look at the whole funnel. Returning-customer revenue, email, and retention work can lower how much you need ads to carry. Track what each new customer really costs with our Customer Acquisition Cost Calculator.
Tips for Using the Calculator Accurately
Use the same date range for ad spend and ad revenue, or the ratio will be misleading.
Include the ad platform's actual charges. Some teams also add creative production or agency fees; just be consistent so comparisons stay fair.
Use revenue as reported for the same attribution window each time you compare campaigns.
Run the numbers per campaign, not just store-wide. A strong campaign can hide a weak one in a blended average.
Always compare the result with your own break-even ROAS before deciding to scale.
Frequently Asked Questions
Final Thoughts
ROAS is useful precisely because it is simple, but its simplicity is also its limit. It tells you how much revenue your ads brought in, not whether you made money. Use this Shopify ROAS Calculator for a fast read on campaign performance, then hold the result up against your own break-even ROAS before you raise or cut spend.
For Shopify's own explanation of the formula and how its marketing analytics reports ROAS, see Shopify's ROAS formula guide.
Try the Shopify ROAS Calculator above with your latest campaign numbers and see where your ads really stand.